


Bitcoin (BTC) sought to erase 3% overnight losses on Wednesday as crypto markets digested the Democratic sweep of the midterm elections.
Key points:
- Bitcoin fell to $75,618 as Democrats won control of both the House and Senate in the US midterm elections.
- BTC/USD rebounded to overhead resistance at $78,000, while S&P 500 futures were down 0.3% on Wednesday.
- Analysts warned that BTC must defend its 50-week moving average, now at $75,733, to avoid a deeper correction.
US midterm vote sparks sub-$76,000 BTC price dip
Data from TradingView showed BTC/USD falling into Tuesday’s daily close as election results came in, with Democrats going on to win control of both the House and Senate. The pair dropped to a low of $75,618 on Bitstamp, a level last seen on Sept. 16, before rebounding as high as $78,039 over the next three hours.

BTC/USD one-hour chart. Source: Cointelegraph/TradingView
Data from CoinGlass showed the price dip liquidating late BTC long positions below $76,000, while a wall of asks kept upside contained below $78,000. Total crypto long liquidations over the past 24 hours stood at $288 million.

BTC liquidation heatmap. Source: CoinGlass
In comments sent to Cointelegraph, Kelly Ye, head of research at institutional digital asset trading platform Talos, said that markets had largely priced in the election outcome.
“Bitcoin moved about 1.7% after the polls closed, close to the roughly 1.8% options had priced, and there was no major leverage flush. The election was the main event, but markets had largely prepared for it,” she said.
US stock futures showed similar moves, initially falling before recouping some losses. S&P 500 and Nasdaq 100 futures were both down by about 0.3% at the time of writing.
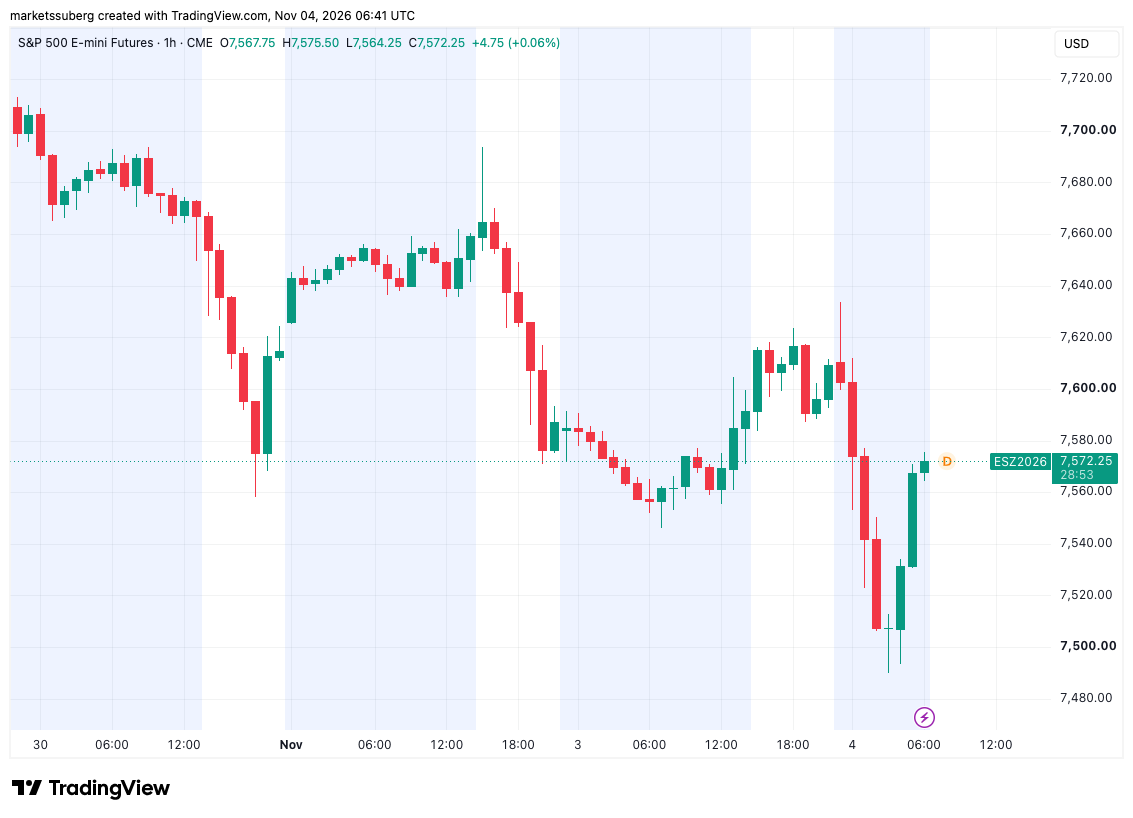
S&P 500 futures one-hour chart. Source: Cointelegraph/TradingView
Late Tuesday, Anthony Saglimbene, chief market strategist at financial services company Ameriprise Financial, told CNBC that concerns over data-center and broader AI capital expenditure were producing an adverse market reaction to the Democratic gains.
“If you get some governorships that are Democratic, what does that mean for the data center buildout, which has already seen a lot of skepticism over the last couple weeks in terms of the hyperscaler capex spending?” he asked.
In an interview with The Wall Street Journal, US President Donald Trump, who previously said he could become “Mr. Veto” to block Democratic policy initiatives, struck a conciliatory tone.
“I think we’ll work with the Democrats, and we’ll get along very well with them,” he said.
Bitcoin 50-week trend line key to avoiding “deeper correction”
Bitcoin’s drop to $75,618 coincided with its 50-week simple moving average (SMA), a trend line that has held as support since mid-September.
Related: Here’s what happened in crypto today
In an analysis posted on X, Keith Alan, co-founder of crypto trading suite Material Indicators, identified the 50-week SMA as a line in the sand for Bitcoin bulls. Failure to defend it, he argued, would open the door to a “deeper correction ahead.”
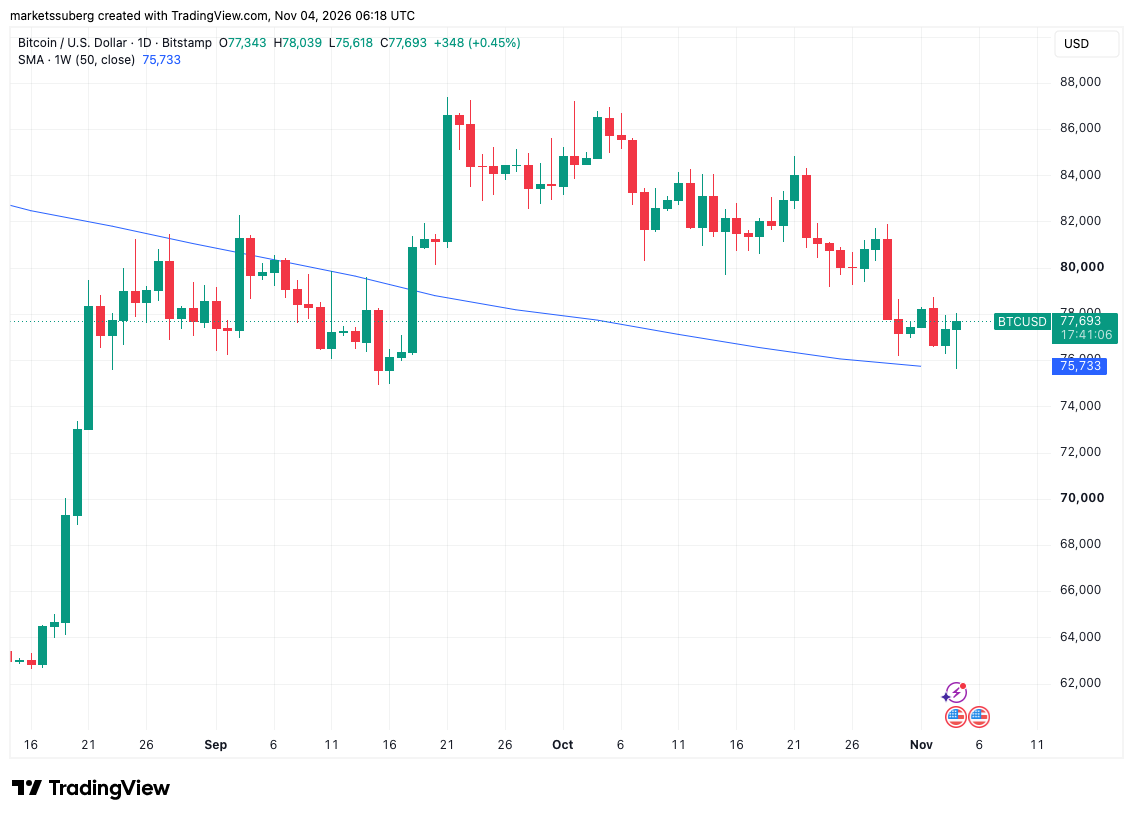
BTC/USD one-day chart with 50 SMA. Source: Cointelegraph/TradingView
Crypto trader and analyst Rekt Capital, who had forecast BTC/USD dipping below $76,000 after a failed breakout attempt above $78,000, continued to flag overhead resistance on the three-day chart.
“If this continues then these newfound 3-Day Lower Highs may guide price back towards the ~$75.5k level below over time,” he said on Wednesday.
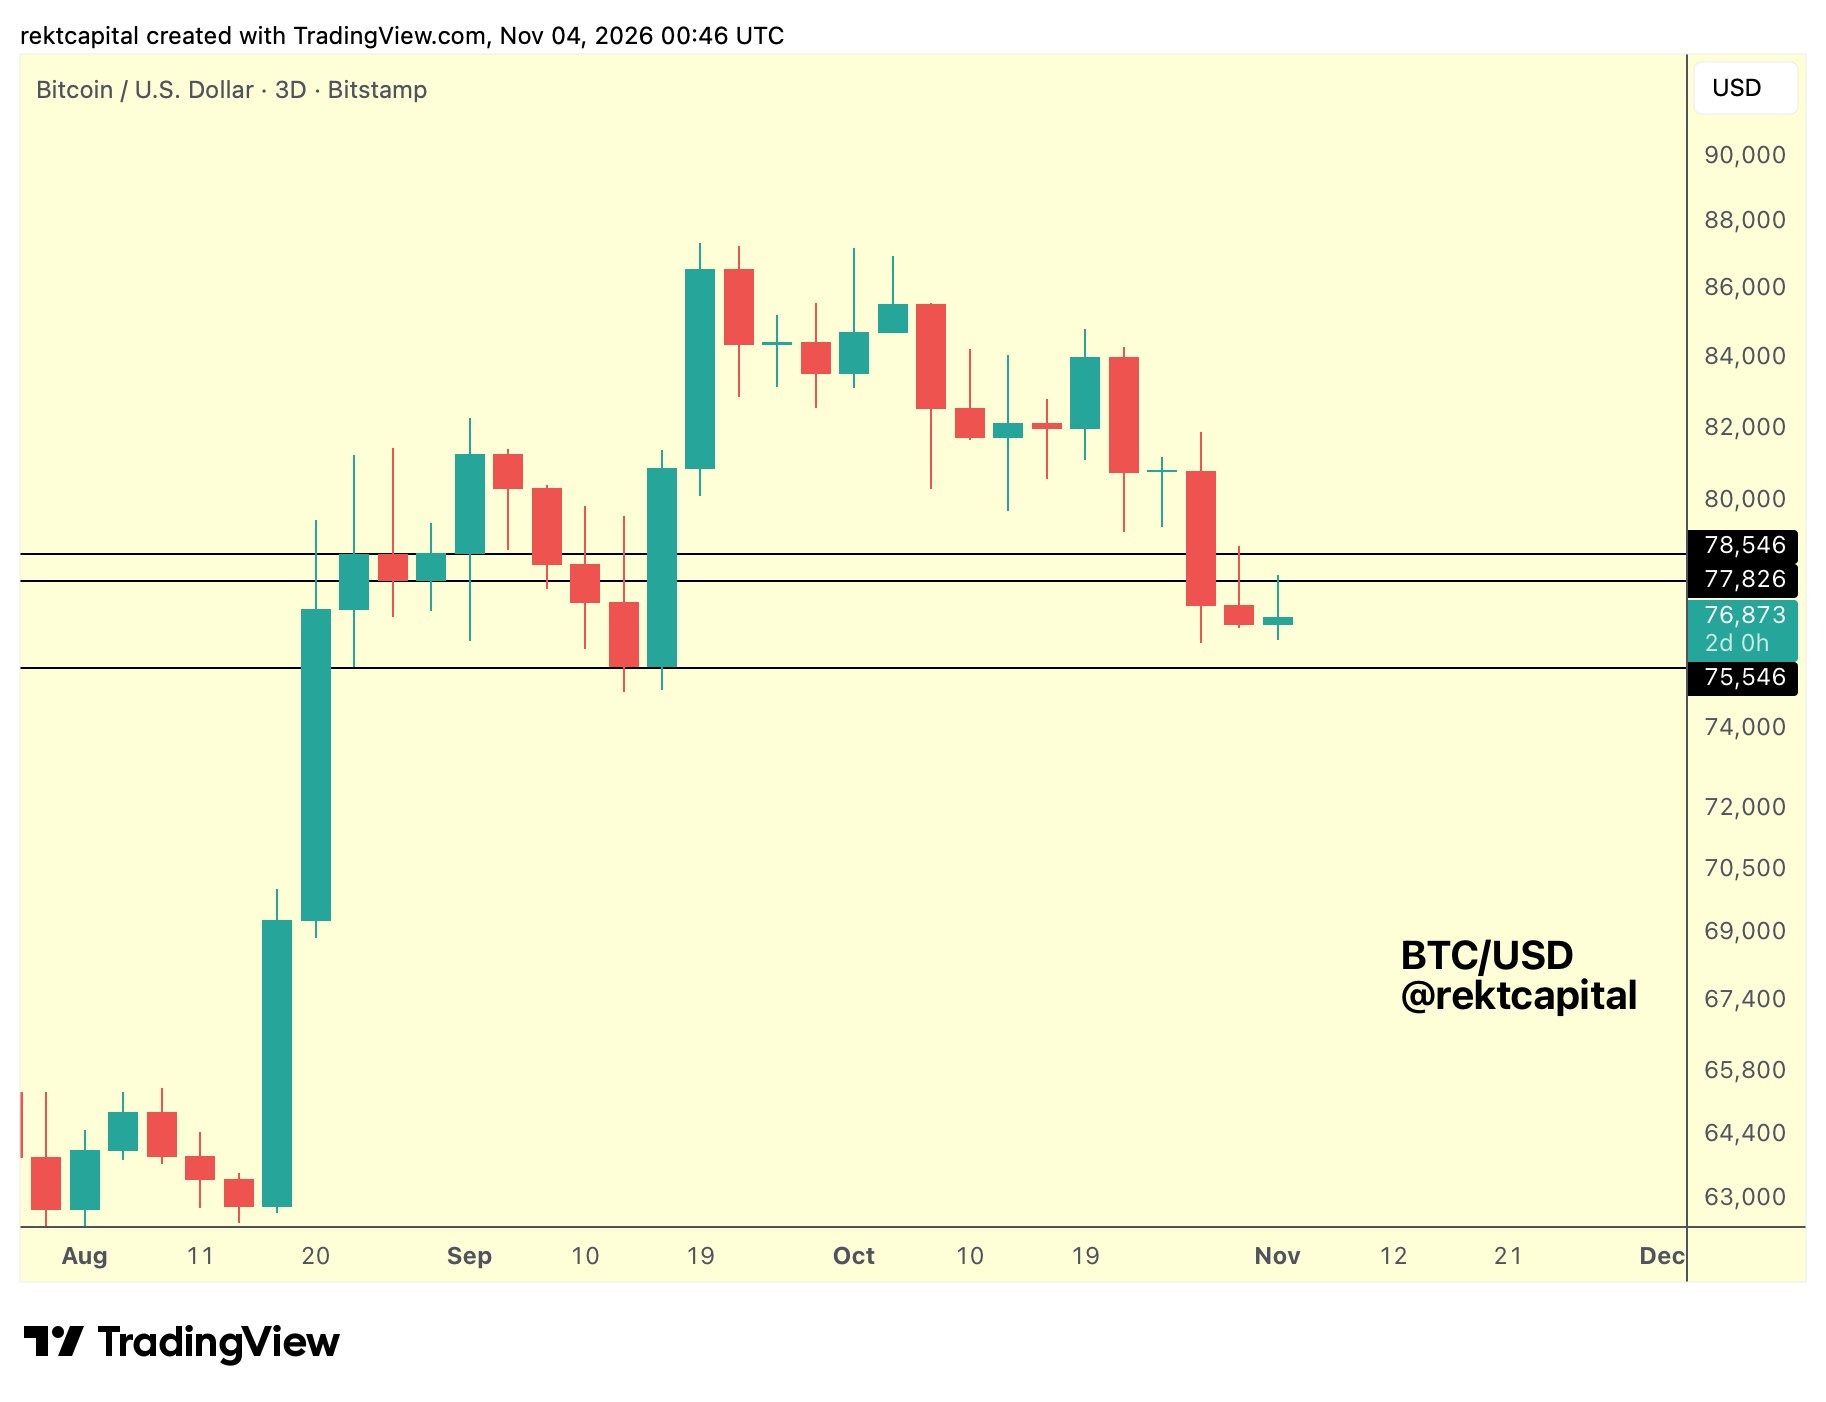
BTC/USD three-day chart. Source: Rekt Capital on X.com

